In Tableau, adding colour to a table using a measure is very simple. However, adding colour to a Tableau table using a dimension is more complicated.
A heatmap (or highlight table) is basically a table with colour. Usually the colour is from a measure (green pill) – for example, colouring by sales high to low, or something similar.
However, there are times to colour a heatmap by a dimension (a blue pill). For example, perhaps there’s a crosstab table of sub-category and month, which should colour each sub-category by its category.
If building a dimension based heatmap using the Square mark type, the same way as using a measure to colour, you’re likely to experience the colour coming out of the cell.
The colour coming out of the cell is annoying, but simple to fix with a slight change in technique.
How to colour a Heatmap with a Dimension
To create a heatmap/highlight table using a dimension to colour, start by laying out the table.
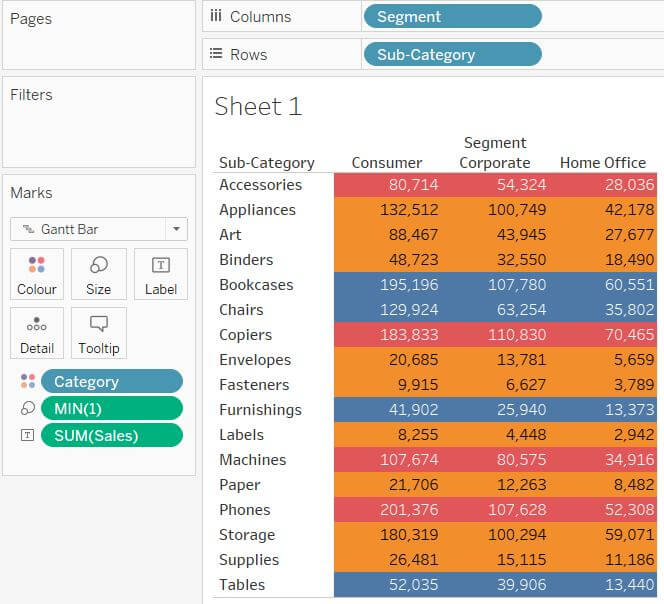
In this example, using Sample Superstore, show Sales by Sub-category and Segment. Then colour each cell by the Category.
Put Segment to Columns, Sub-category to Rows and Sum of Sales to Text.

Next, change the mark type to Gantt Bar. Then drag Category to the Colour shelf.
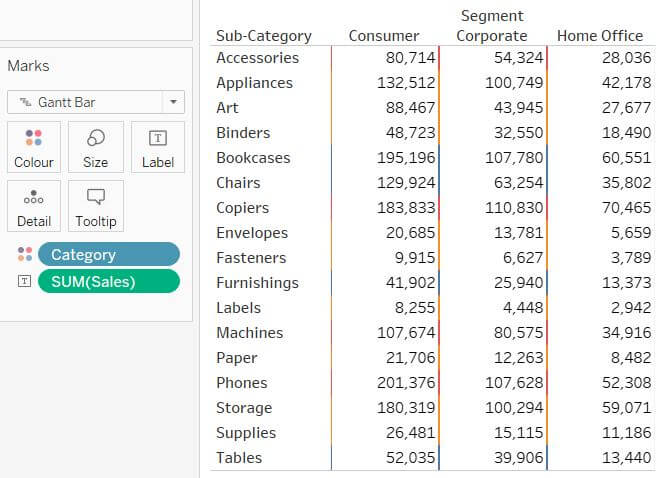
Observe the colour being a simple line. To make the heatmap, that colour should cover the entire cell.
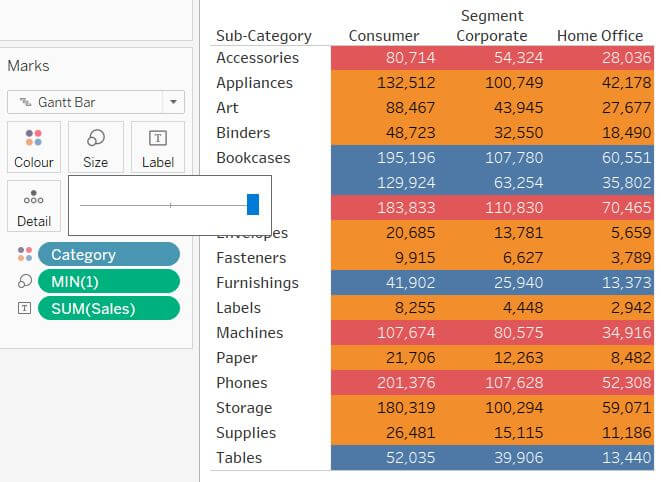
To colour the entire cell, create a simple calculation with the value 1. (Very useful calculation to have in all workbooks; it works well as a placeholder for complex tables, and also to count the number of records.)

Put this on the Size shelf and change the aggregation to Min. Therefore, it will always return the value 1. Summing would inadvertently sum the number of records, producing the small bar chart affect in the image above.
Finally, click on the Size box and drag the size out to fill the space.
And that’s it, a simple way to create a heatmap in Tableau using a dimension to colour!
If curious, change the mark type to Square and remove the MIN(1) from the Size shelf. Exactly like a standard measure-coloured heatmap. Try and get the colour to cleanly fill the cell!
Brilliant – thank you 🙂
It helped me a lot, thanks!
Excellent! thanks