Tableau Viz in Tooltip for Totals
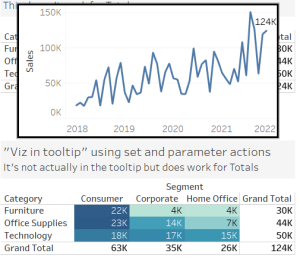
The viz in tooltip doesn’t work for totals in Tableau. Which is annoying. Apparently, this was a deliberate decision by Tableau. But still annoying. Perhaps …
The viz in tooltip doesn’t work for totals in Tableau. Which is annoying. Apparently, this was a deliberate decision by Tableau. But still annoying. Perhaps …

Dynamic Zone Visibility entered the Tableau toolkit with Tableau 2022, and it’s a game changer for sheet swapping. Prior to the existence of Dynamic Zone …

Sorting in Tableau can be perplexing. Sometimes Tableau sorting appears to not work, it may not do as expected. Sometimes the sort doesn’t seem to …

Quick tip on how to create a blank field name in Tableau. Create a calculated field to be the blank column and save it as …
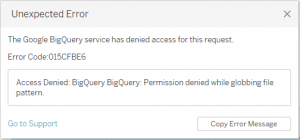
Using the Google Cloud Platform with Tableau, and getting the error, “Permission denied while globbing file pattern”? To create this error, put a file into …
This article explains how to get a Tableau filter action to open in the same tab. The default behaviour of Tableau Server is to open …

This post explains the different options to write IF statements in Tableau. This includes IF, IIF, and CASE, with a brief mention of IFNULL. The …

This is a non-techie guide to connect to AWS Athena from Tableau. If you’re struggling, like I was, hopefully this will help! Athena is one …

In Tableau, adding colour to a table using a measure is very simple. However, adding colour to a Tableau table using a dimension is more …
Use row level security in Tableau to control who is able to see what data within a Tableau dashboard and Tableau data source. I tend …