The viz in tooltip doesn’t work for totals in Tableau. Which is annoying.
Apparently, this was a deliberate decision by Tableau. But still annoying.
Perhaps even more annoying, in older versions of Tableau Desktop, the viz in tooltip does work. But it doesn’t work on Tableau Server.
The good news. There’s a hack. Not super simple, and not quite the same, but a workable alternative.
How to show Viz in Tooltip for Totals
The hack involves set actions, parameter actions & boolean. And dynamic zone visibility. So, not quite as easy as putting a sheet in a tooltip.
Nevertheless, it’s the only workable alternative I know of.
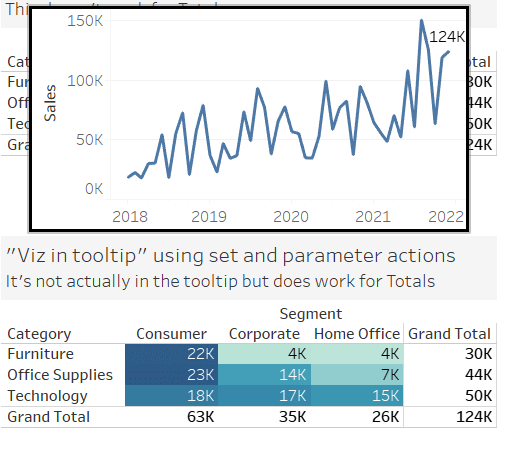
As always, begin with an example. Here’s a simple table, using the Tableau superstore dataset, showing how the viz in tooltip doesn’t work.

So, how to make it work. First, build a simple trend that will show in the tooltip. Actually, near the tooltip.
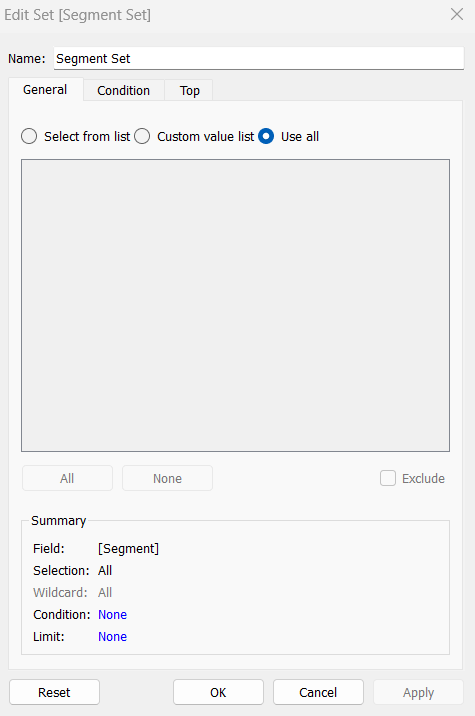
Next, build the necessary items. Each dimension needs a set. For this example that means a set for Category and a set for Segment.
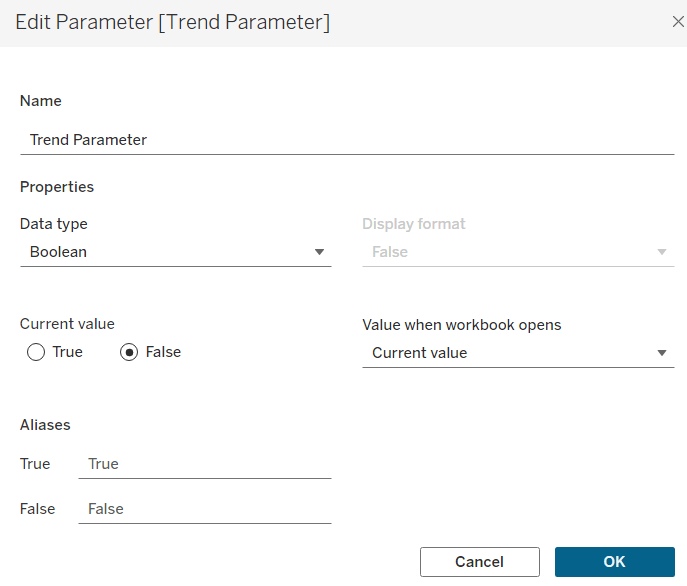
To display (or not) the trend chart means a parameter. Create a simple Boolean parameter, which defaults to False.
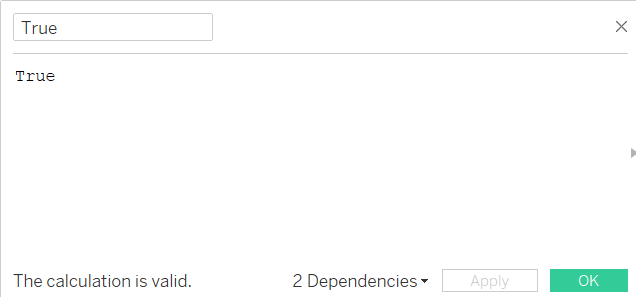
Also, create a Boolean calculated field called True, containing the value True.
Now the jigsaw pieces are there, time to assemble. On the trend chart – the viz to show in tooltip – put the two sets on the filter shelf.

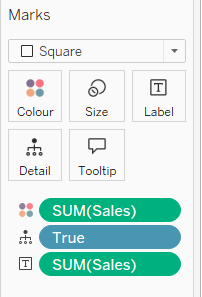
On the table, put the True calculation on the Detail shelf.
Now, put the table on a dashboard. Also, FLOAT the trend on the dashboard, and put in very close vicinity to the table.
Next, make it appear like a viz in (near) tooltip. This is where the dashboard Actions come into play.
Set actions act to filter the trend. The trend should filter when the user hovers over a cell in the table.
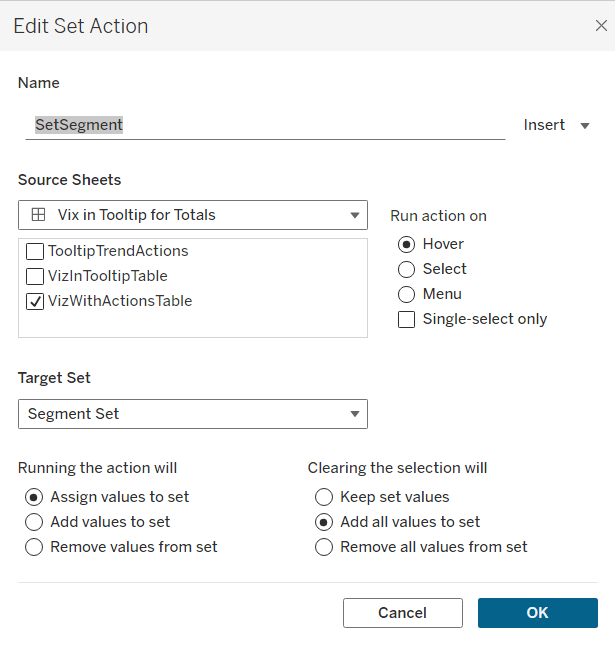
Create a set action for Category and another set action of Segment. The set actions should:
- Source from the table worksheet
- Run on Hover
- Target the relevant set
- Assign values to the set (on running)
- Add all values to the set (on clearing)
If all is correct, hovering over a cell will filter the trend chart.
But, the trend is always visible. Which isn’t what we want. The trend should appear when pointing the mouse at the table. Dynamic Zone Visibility to the rescue!

Select the trend chart on the dashboard, and “Control visibility using value”. Choose the parameter built earlier to control the visibility. And now the trend chart is invisible.
However, another dashboard action can fix that. This time, a parameter action.
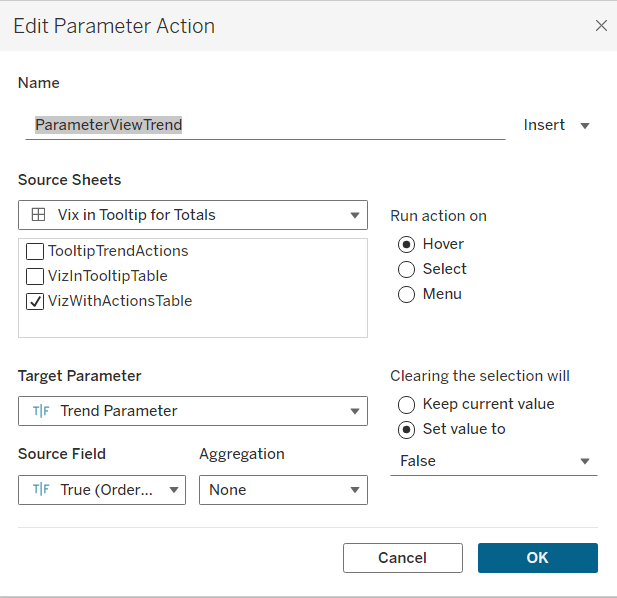
Create a parameter action (Dashboard…Actions in the dashboard menu) with the following settings:
- Source from the table worksheet
- Run on Hover
- Target parameter is that created earlier, and used to control the visibility of the trend
- Source field is the True field – which should be on the Detail shelf of the table
- Aggregation = None
- Changing the selection will Set value to False (i.e. hide the trend)
And that’s it. You’re done. Hover over a total, and the trend will appear (almost) in the tooltip!
Sets, parameter, action!
Downsides to the viz in tooltip hack
Ignoring the number of components to build, the main downside is that it’s not in the tooltip. It must float somewhere outside of the table. Which generally is fine. But if you have a really big table, that can be a problem.
Viz in tooltip in totals download
To download this hack to show the viz in tooltip for the totals in Tableau, go here in Tableau Public.