Do you want to maintain the rank when using a viz in tooltip in Tableau? The default behaviour of a viz in tooltip is to filter the sheet in the tooltip.
Due to the order of operations, this filter impacts the rank. Assuming the filter leaves 1 record, it will automatically rank first. The items are removed (filtered out) from the sheet, then Tableau calculates the rank; hence the remaining item always ranks #1!
To maintain the rank after a filter in a standard chart, use a late filter – a table calculation filter. With a table calculation filter, the filter happens after calculating the rank, therefore it maintains the rank.
However, in this case of a viz in tooltip, the filter happens BEFORE the rank calculation. Hence the rank isn’t maintained when using a viz in tooltip.
The challenge is how to maintain the rank without using a table calculation filter (which I don’t think is possible with a viz in tooltip – but correct me in the comments if I’m wrong).
How to maintain the rank with a viz in tooltip
Fortunately, there is a (partial) solution. Similar to showing grand totals in a viz in tooltip, this solution also uses Set Actions.
This article was inspired by a question on Reddit. While this solution doesn’t give the answer exactly as requested, it’s a good workaround and provides the same information. It actually provides more information!
A simple example is the best way to demonstrate how to use set actions to solve this “rank in tooltip” problem.
Using the sample superstore data set, build a simple bar chart showing profit per market. Build the rank into this chart; for this example I calculate the rank using the Index function. You can easily use a Rank function instead. Whatever you prefer.
The rank calculation uses a Custom sort order, using Sum of Profit, descending. This means it doesn’t matter what order the markets are displayed, the rank will always calculate on the sum of profit.
The tooltip chart isn’t quite complete. Name it TooltipBar, and we’ll come back to finish it shortly.
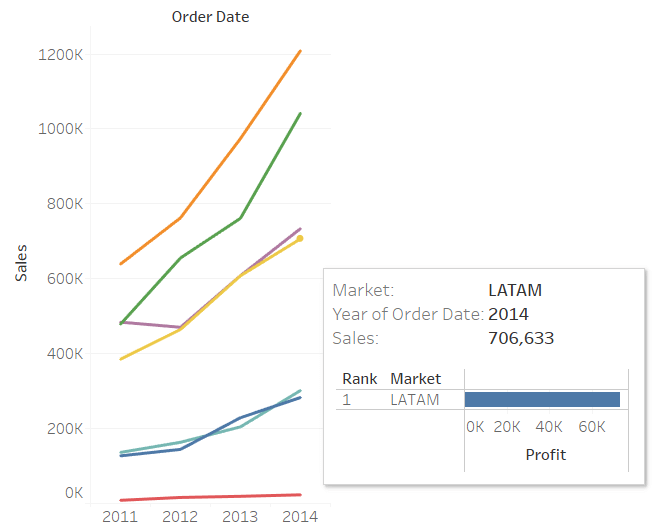
Next build a simple line chart. This chart will appear on the Tableau dashboard, and when the user hovers over a line, the bar chart will appear in the tooltip.
This line chart is showing sales over time, with each line representing a Market.
Now create the viz in tooltip. Edit the tooltip and insert the sheet.

Hover over a line and it will filter the bar chart by time period and market. As this filters for one Market, the rank is always 1. We don’t want this to happen, so we turn to set actions.
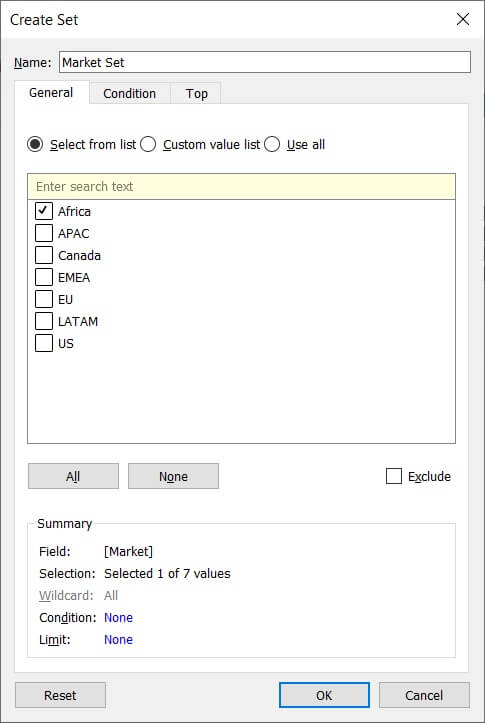
Return to the bar chart, the chart for the tooltip. Right click on the Market pill in the list of dimensions and Create – Set.

Choose any one Market for this set. Which you choose doesn’t matter – the set action means it will change in the tooltip.
Put the Market Set pill on the chart, make it the first pill on Rows. This means it sorts the Markets, so the Market in the set appears on top. Also, to make sure the rank is correct, Edit Table Calculation of the rank calculation. Make sure to select/check the Market Set dimension, so the rank calculation ignores this field.
Return to the Line sheet, and alter the tooltip. Remove the filter fields from the viz in tooltip.

This stops the tooltip viz filtering; instead the set and set actions will handle the display.
Almost completed; to finish build a dashboard and create the set action.
Build the dashboard and Set Action
Open a new blank dashboard and add the line chart to the dashboard.
Next create the Set Action: Dashboard – Actions on the menu bar.
Create a new Set Action. Add Action – Change Set Values.
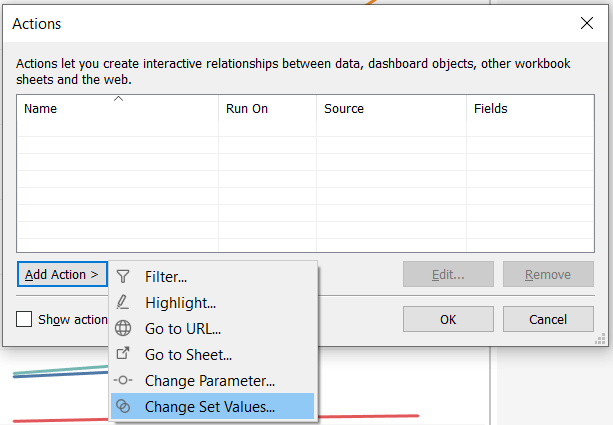
On Hover it should Assign Values to Set, with the Market Set being the set to change. Clearing the selection will “Keep set values”. Ensure it’s set to run on Hover, so it runs as the tooltip appears.

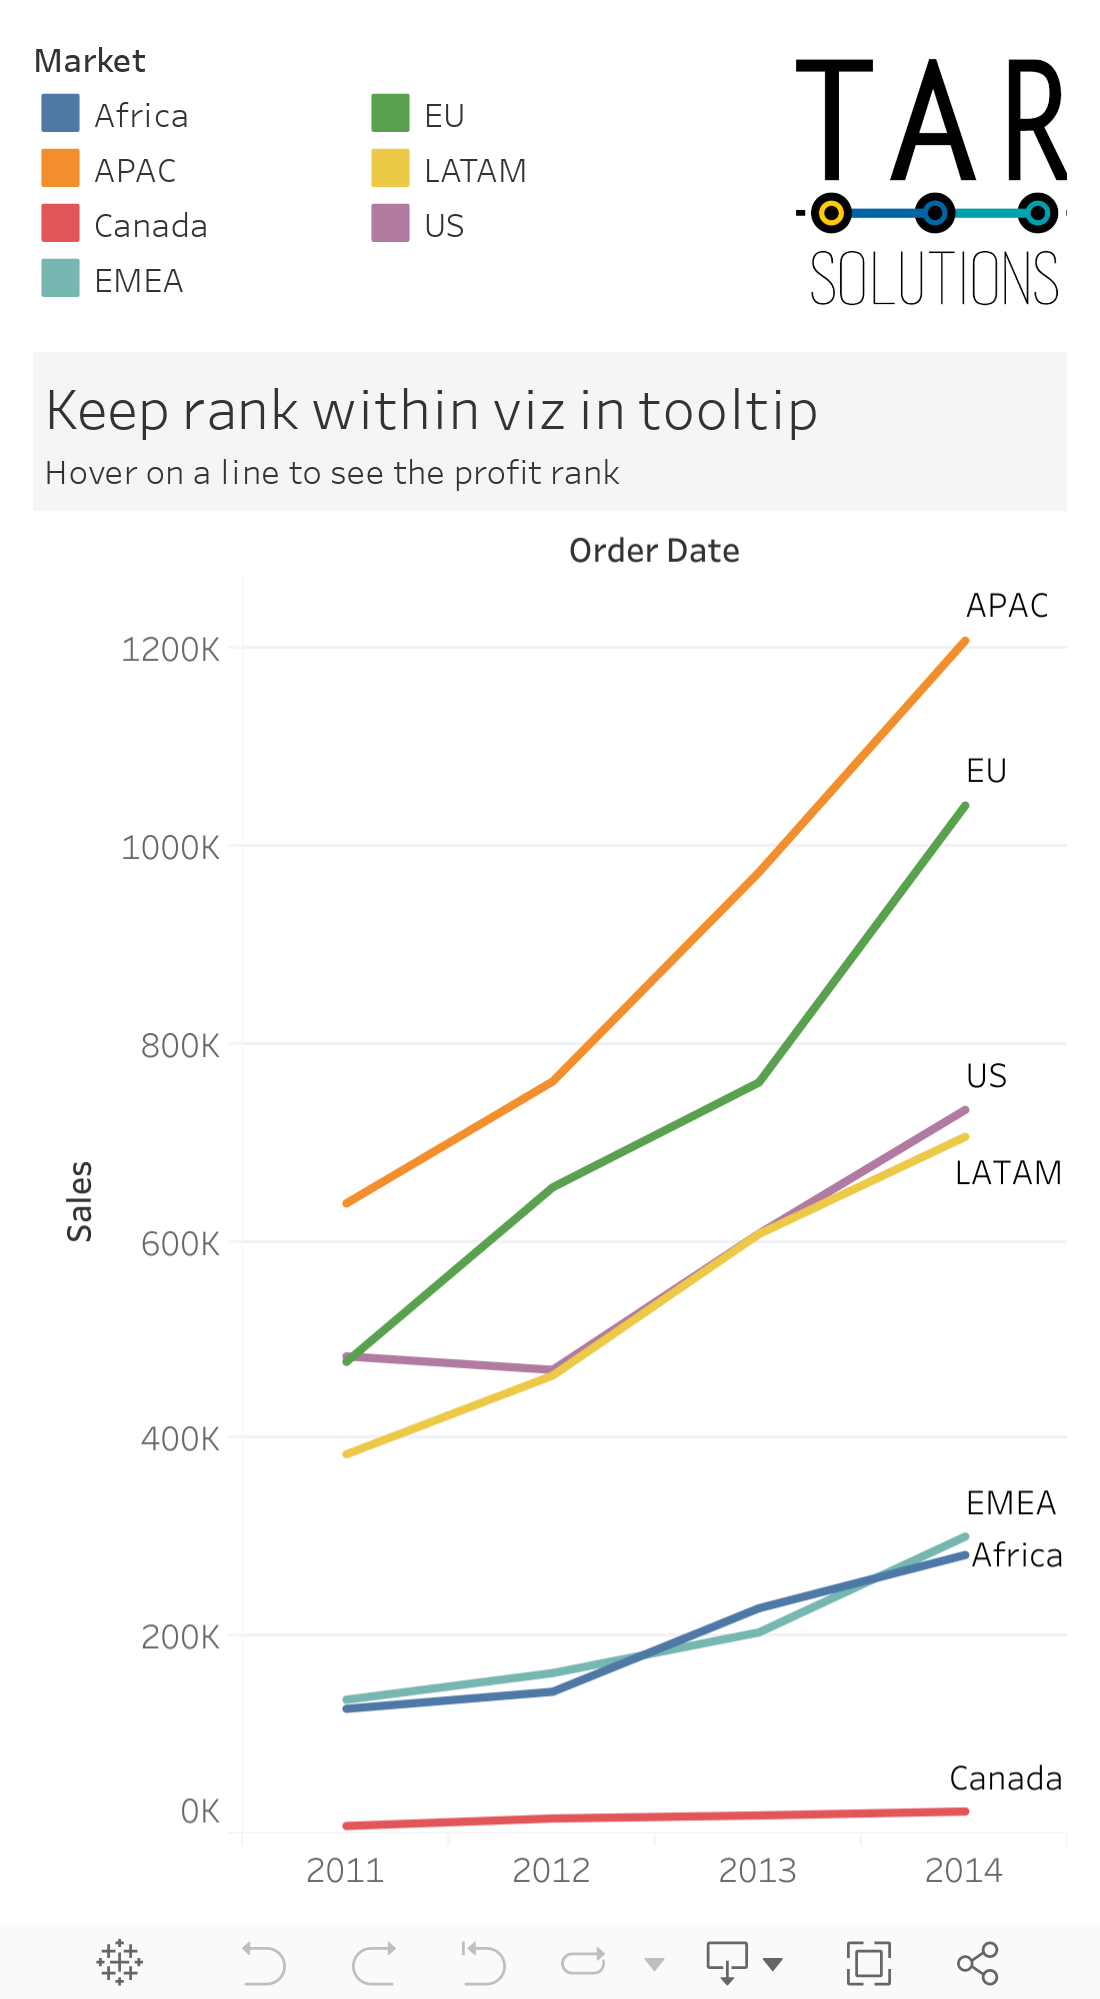
And that’s it! When hovering on a Market line, it will display the bar chart in the tooltip, with that Market appearing at the top of the bar chart, showing the rank alongside.
Tidy the tooltip bar chart, you can colour the market, also size the market in the set larger than those not in the set. Hiding the header of the Set field also improves the appearance.
Want to master set actions in Tableau? Take this 2.5 hour online course, a Tableau Masterclass in Parameter and Set Actions.*
See below, the example is embedded from Tableau Public. If it’s not loading, click here to view it on Tableau Public.
*We may earn an affiliate commission if you purchase this course