Do you have a table on a Tableau dashboard that you need to automatically resize dependent on the number of rows within the table? Maybe applying a filter leaves a lot of white space under the table? Perhaps you’re using a parameter allowing the user to dynamically choose the dimension to slice their data.
The good news is using containers can solve this problem. Using a Tableau container can make the space for your table collapse, eliminating the white space.
How do I use a container to make my table automatically adjust the height?
To show you how to use the containers I’ll create an example. Similar to sheet swapping using parameters in Tableau, containers allow components to expand and collapse.
The first thing to note, none of the items are floating.
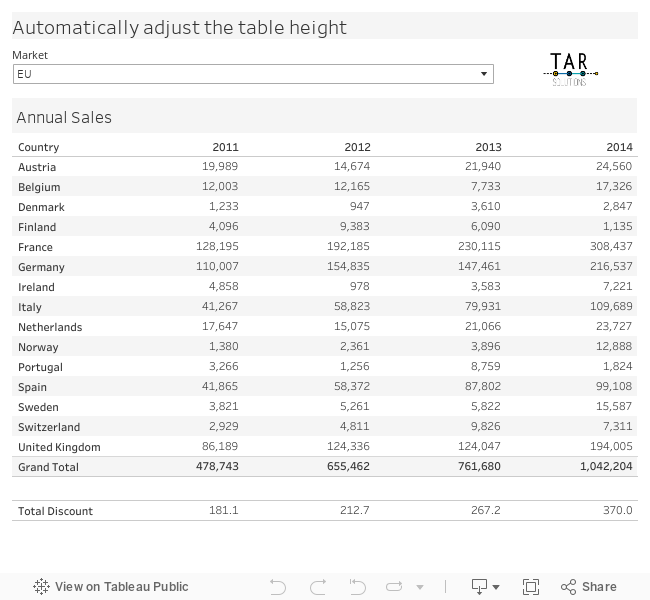
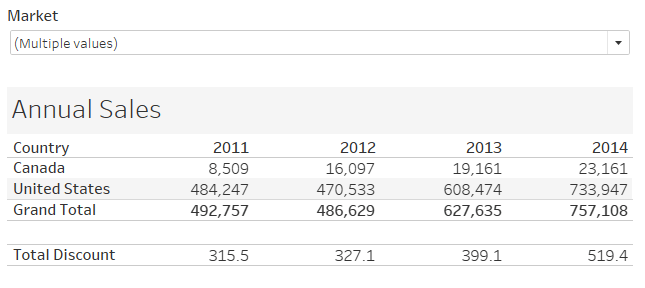
Using the sample superstore data source, build a simple table showing sales per year per country.

Create another table, which will sit underneath this in the dashboard, showing the total discount.

Notice the filter for Market, which applies to both worksheets.
Build your dashboard using a vertical container, making the table resize
Our dashboard is going to be very simple, containing the 2 tables and a filter.
Create a new dashboard and drag in the Country table. Next drag in a Vertical Container below the table.

The next step is to place the Country table into the container.
This is important – to drop an object into a Tableau container, click-drag and hold it over the container. When the container outline turns blue you can drop the object; when the container outline is blue it means the item will fit within it.

Dropping the table within the container should then fill the screen with the table once again.
You can check it’s in the container using the Item Hierarchy of the Layout section of the dashboard.
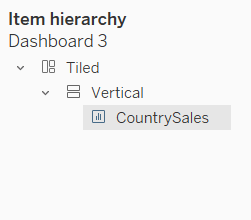
You could even rename the Vertical container should you have many items on your dashboard. Right-click Vertical in the Item hierarchy to get the rename option.
Next drop the Discount table into the vertical container, below the Country table.
Again, the container outline will be blue when dropping into the container. If it’s not blue then you’re dropping outside the container.

Making sure the country table resizes in the dashboard
For the Country table to resize make sure the size is not fixed. If it is fixed then un-check the fixed pin.

The Fix pin has to be transparent, as in the image above.
Finishing up your automatically adjusting dynamic height table!
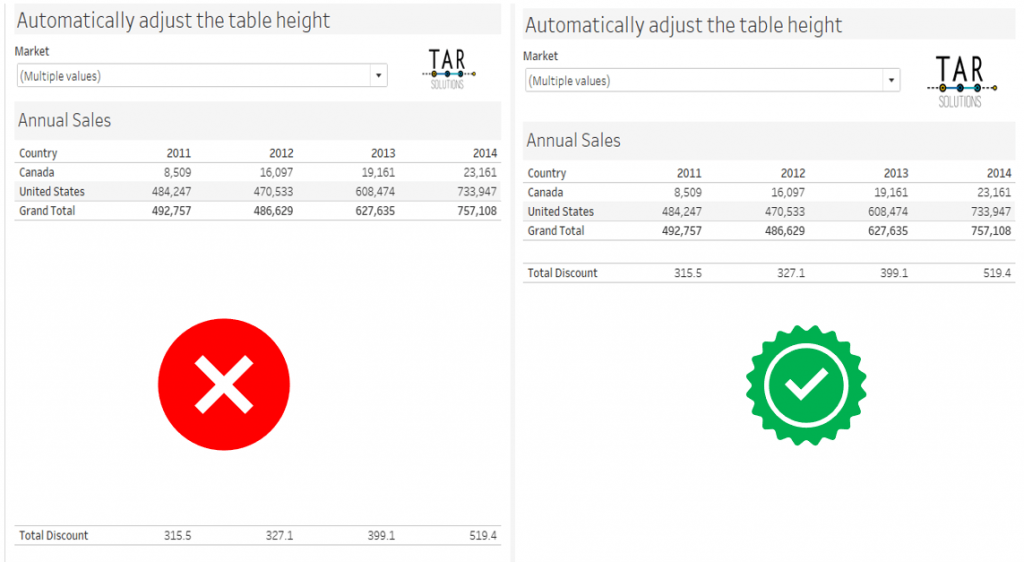
Almost there now. Show your filter; in this case we use the Market field. Make sure this is not within the container. Filter the data to test it’s working. The Country table should adjust the height based on the filter selection.
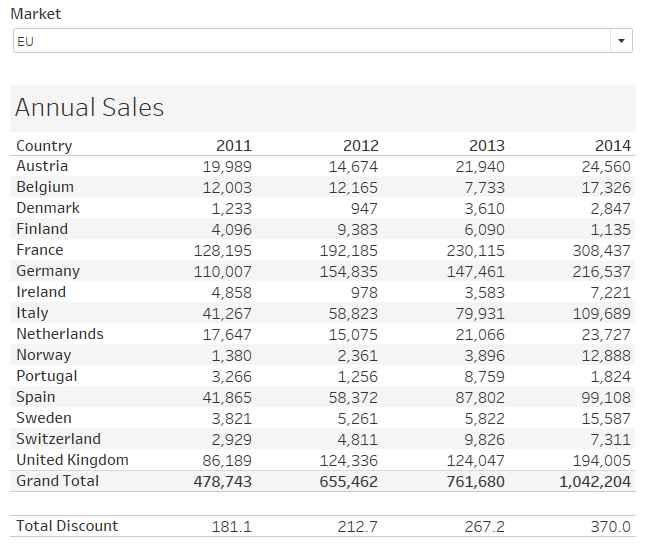
For example, with the EU Market selected:
Changing the selection to the US and Canada reduces the height of the table:
Set the tables to Fit Width, tidy the titles, headers, etc, and you’re done!
Below is the interactive version of this, which you can also download from Tableau Public.