This post shows how to create a candlestick chart in Tableau.
It shows two different techniques to build a tableau candlestick chart.
The first technique uses a dual axis gantt. The second technique uses reference lines.

What is a candlestick chart?
The most common use of a candlestick chart is to show stock price movements.
A candlestick chart shows the Open, Close, High and Low price of a stock over a given period.
In addition the colour shows whether the price is up or down on the day.
To build a candlestick chart in Tableau the first thing is to get some daily share price data. As I learnt Tableau while working at Homeaway.com for this exercise we will use their share price data.
The Nasdaq website has freely available daily stock data for the past 2 years.
The dataset is very simple. It contains the date, open price, close price, day high, day low and the volume. I added the ticker as well, although unnecessary when only looking at one stock.

How to build a Tableau candlestick chart using a Gantt
I prefer this method to build a candlestick chart in Tableau. This allows more spacing between the candles than using reference lines.
In the data source, for each date, there is one open value, one close value, one high value and one low value.
Therefore begin by putting the Date to columns and setting the chart type to Gantt.
Put the MIN of Open and High to the Rows and set it to be Dual Axis. Synchronise the axis and uncheck “Include 0”.
Assuming everything is correct the chart should look something like this:

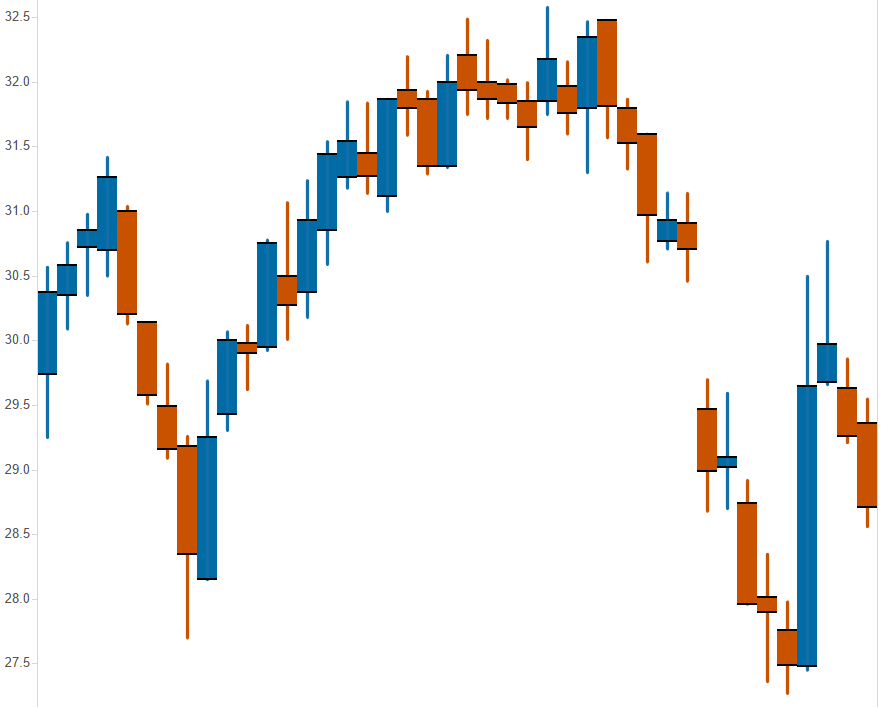
Although it doesn’t look like it, these are the foundations of both the candle and the wick.
Build the candle and the wick of the candlestick
The candle, which is the difference between Open and Close.
Next step is to fill out the candle and the wick. For that create 2 calculated fields.
(MIN([Open])-MIN([Close]))*-1
The wick, which is the difference between High and Low.
(MIN([High])-MIN([Low]))*-1
The results of both are turned negative (multiply by -1) to get the fill in the right direction.
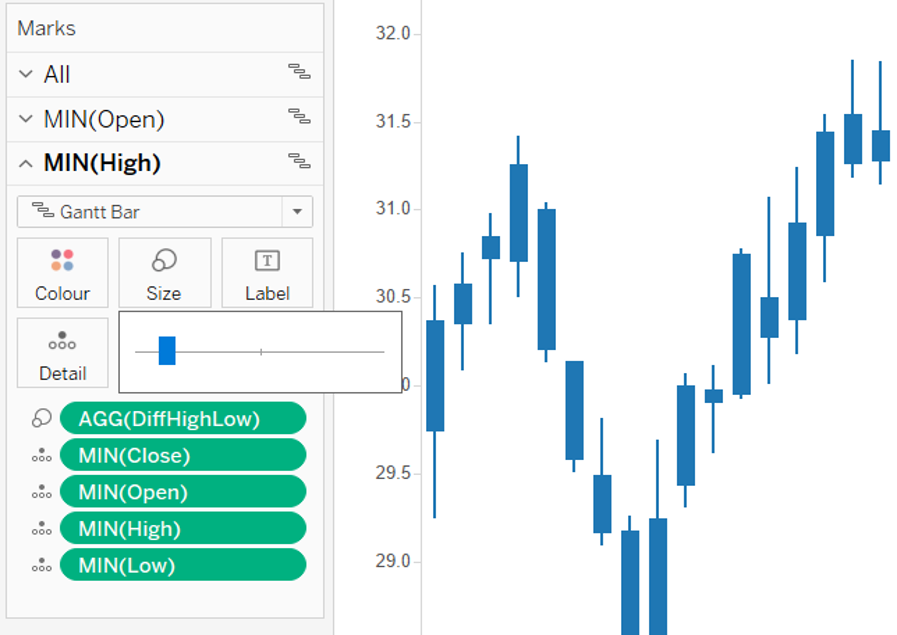
Put the difference between Open and Close on the Size shelf of MIN(Open)
Do the same with MIN(High) but use the difference between High and Low. This forms the wick.
To make it look like a wick Click on the Size pill of the MIN(High) gantt bar and drag to the left.
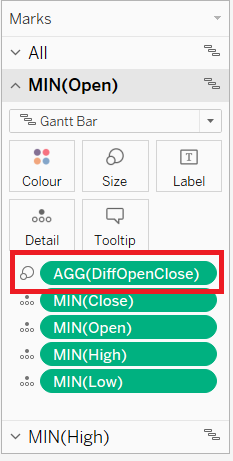
Next to colour the candle and wick by whether it was up or down on the day.
Using the field calculating the difference between open and close price, DiffOpenClose in this example, put this on the Colour shelf of All. Edit the colours as you prefer.
And that’s it! Format and tidy your candlestick chart however you prefer.
How to build a candlestick chart in Tableau using reference lines
An alternative way to build a Tableau candlestick chart is using reference lines and a line chart.
Begin by creating the line chart.
To build the chart firstly we plot out the daily high and daily low values.
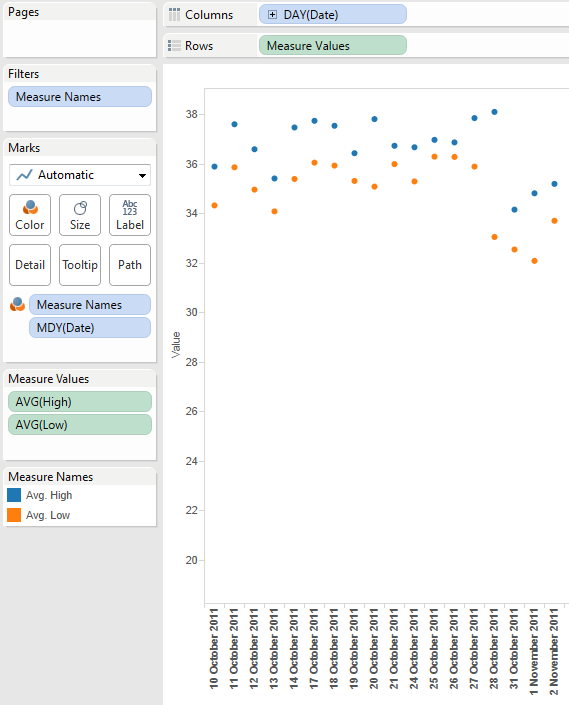
Put the date field to the Columns shelf using the continuous Day or Exact Date setting.
Next drag the High pill to the Rows and set it to AVG, therefore giving a line chart of the daily high values.
Put the Low on the chart and set to AVG. This is now a line of daily highs and daily lows.

Hint: If you drag the Low pill to the Y axis, poorly circled in red, and drop it there, this will automatically show both lines on the same chart.
Build the candle wick
With a candlestick chart the high and low forms the candle wick. To create the wick first change the Date pill to be Discrete (blue).
To separate out each day put the Date field on the Detail shelf and set it to a dimension with MDY.
Also edit the Y axis, it doesn’t need to show the zero (right click on the axis, Edit Axis, uncheck the Include Zero box). Now there are many dots on the chart representing the daily highs and lows. Connect these dots to create the wick of the candle.
A simple calculated field completes the wick. Name the calculated field [Up or Down] and the formula is as follows:
IF AVG([Close]) > AVG([Open]) THEN “Up” ELSE “Down” END.
In other words if the close is greater then the open it is up otherwise it is down.
To complete the candle wicks of the candlestick chart put [Up or Down] on the Colour shelf. Change the colours to represent up and down. In this example the Up is blue and red is Down.

Build the candle body
Next build the candle body. This is based on the Open and Close price. A combination of Reference lines and formulae create the candle body. To begin we’ll create the candles for those that closed up after the days trading.
- Drag the Open and Close fields to the Detail shelf, and set both to AVG
- Create a new calculated field called Closed Up
- The formula for Closed Up is IF AVG([Close])>AVG([Open]) THEN AVG([Close]) END
- Drag Closed Up to the Detail shelf
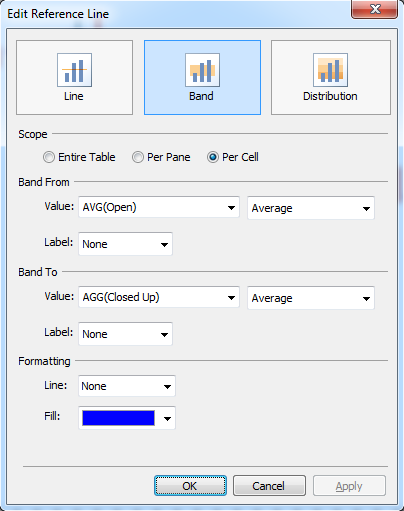
- Right click in the Y axis and select Reference Lines
- The reference line for those that closed up will be a Band with a Scope of Cell, starting with the AVG(Open) and ending with the AGG(Closed Up). Colour it the same as the wick colour.
That leaves those that closed down which, as you might expect, is very similar to building the candle for Closed Up:
- Create a new calculated field called Closed Down
- The formula for Closed Down is IF AVG([Open])> AVG([Close]) THEN AVG([Open]) END
- Drag Closed Down to the Detail shelf
- Right click in the Y axis to add a new reference line and set it up as follows:

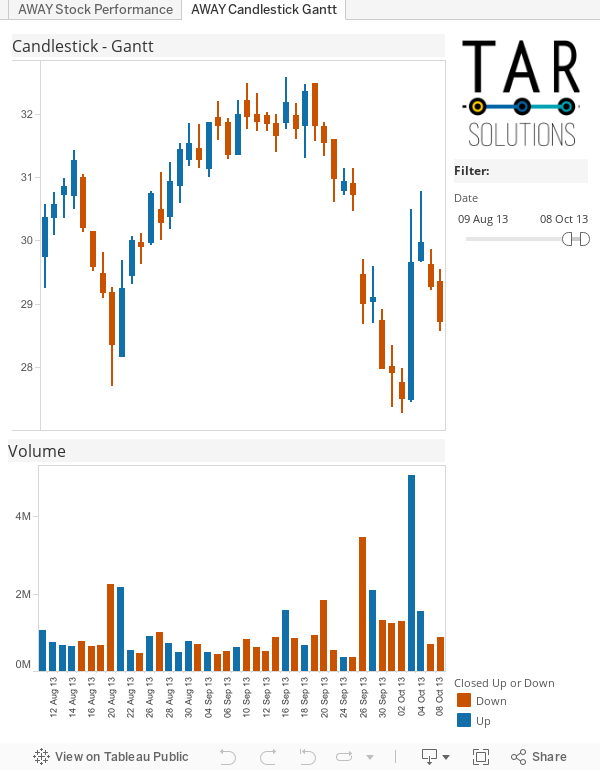
Now you should see the completed candlestick chart using reference lines.
In the candlestick dashboard I also added a Volume chart, which is very simple to do. It’s a simple bar chart coloured using the [Up or Down] pill.
Download the workbook from Tableau Public to see how it was all put together.
Other useful chart types you may want to build in Tableau include:
Can we integrate volume bar with the candlestick in the same chart section?
Yes, you can drag the volume field alongside the Measure Values on Rows. That will bring them into the same chart. Make dual axis if you want to report together.
Please can you make videos presentation of these tutorial for proper understanding of it.