Dates in Tableau automatically fit into a standard date hierarchy. Year – Quarter – Month – Day is the default.
All date fields naturally fit into that hierarchy. To get the dates OUT of a hierarchy takes work, but it’s automatic for them to be in the hierarchy.
Include the Week in a Tableau Date Hierarchy
What happens if you want to change the standard Tableau date hierarchy?
For example, perhaps you also want the Week included.
Fortunately, it is simple to build a custom date hierarchy in Tableau.
Recently I had a client request to drill into their data from Year – Month – Day AND Year – Week – Day. Both of these differ to the default date hierarchy in Tableau.

Adding Week into a date hierarchy adds a degree of complexity.
This is because weeks generally don’t span quarters and months in a neat way.
For example only on rare occasions is the first of the month also the first day of the week.
Similarly, the last day of the month is rarely the last day of the week.
Almost always the end of the current month and the beginning of the next month will happen in the same week. In other words some weeks will span 2 different months.
The answer is to customise the date hierarchy.
Create a Year – Week – Day hierarchy in Tableau
First build the Year – Week – Day hierarchy. In another post I described how to build a hierarchy in Tableau.
Building on that post, make use of calculated fields to build a Year – Week – Day date hierarchy.
To create the hierarchy, it requires extracting the relevant date parts from the date field:
- Year
- Week
- Day
The below example uses the sample Tableau Superstores data. The Order Date is the date field.
Create the following calculated fields:
[Year]: YEAR([Order Date])
[Week]: DATEPART('week',[Order Date])
[Day]: DAY([Order Date])
Convert the fields to dimensions (they default to measures as the result is an integer) and build the hierarchy.
Call the hierarchy Year – Week and order it correctly; the Order Year first, then Order Week, and finally Order Day.
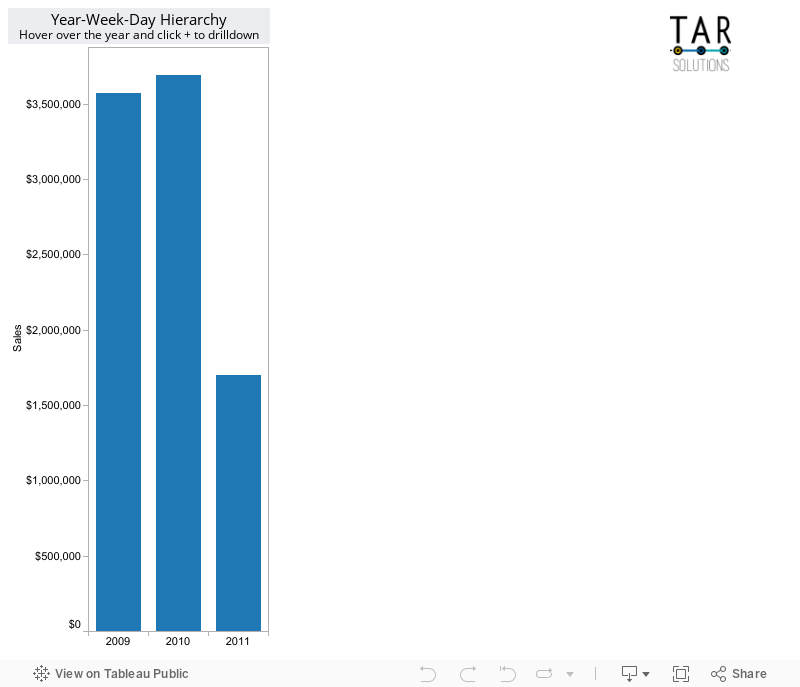
Put the [Year – Week] hierarchy on the Columns shelf and Sales on the Rows shelf.
To test the hierarchy click the + on the [Order Year] pill and the [Order Week] should appear. The + sign indicates it’s a hierarchy.
Once the hierarchy is expanded, use the – (minus) sign to drill back up.
Create the Year – Month – Day hierarchy
For the Year – Month – Day hierarchy the basic steps are the same as above.
This is still a custom hierarchy; the default includes the Quarter, which is not wanted in this example.
Create a new calculated field for Month:
[Month]: MONTH([Order Date])
Also duplicate the existing Year and Day fields.
Each dimension can only be in one hierarchy, the two hierarchies can’t share fields, therefore we duplicate the fields.
Using the new fields, create a new hierarchy for the Year – Month – Day.
Combining week and month into one hierarchy doesn’t work. See below what happens when combining Year – Month – Week – Day into a single hierarchy. Sometimes the week number crosses more than one month.
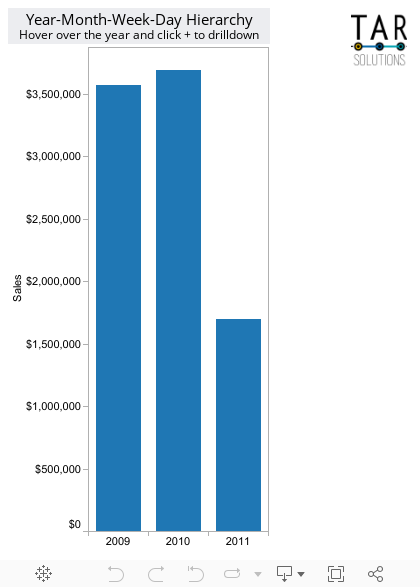
Therefore the hierarchies have to be separate.
However, this doesn’t mean we need two different hierarchies.
We can be smart and keep one hierarchy, but make the hierarchy flexible.
Best to give the user the power to switch between the Week and Month fields.
Create the combined Year – Week / Month – Day hierarchy
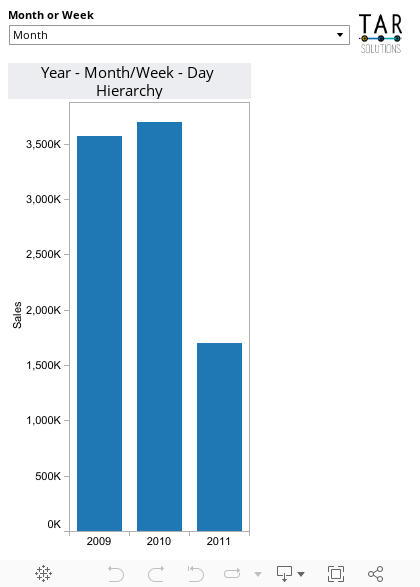
Combining a parameter and calculated field gives the user the flexibility to switch between time periods.
Create a String parameter and set it up as a List with two options for the user, Week or Month. Show this parameter control on the worksheet.

Next create a calculated field using the parameter.
[WeekOrMonth]: IIF([Month or Week]= 'Week',[Week],[Month])
When the users selects Week in the parameter it uses the [Week] field. Similarly when the user selects Month it users the [Month] field.
Edit the Year-Week hierarchy and replace [Week] with this new [WeekOrMonth] field.

Now when drilling down through the dates, the parameter selection defines whether the week or the month is displayed
Finally tidy the hierarchy to show the Month name or Week Number
I prefer when the Month shows the name instead of the number. For ease of reading I will prefix the week numbers with the word ‘Week’.
To do this edit the WeekOrMonth calculated field. Change the formula to be :
[WeekOrMonth]: IIF([Month or Week]= 'Week','Week ' + STR(DATEPART('week',[Order Date])),DATENAME('month',[Order Date]))
The final result is as below:
Remove the hierarchy from a tableau date
At the beginning of the post I stated it’s possible to remove the hierarchy from date fields.
With hierarchies being automatic for date fields, this can cause users to accidentally expand the hierarchy in bar charts, etc. This can provide a bad user experience if the user did this mistakenly and doesn’t know how to reverse it.
Prevent accidental drill down in a date hierarchy
To prevent this we isolate each date component as a separate field. Instead of putting the Date field to a chart and showing the Year, we create the Year field as a separate calculated field.
YEAR([DateField])As the separate calculated fields return an Integer – the year is just a 4 digit number – Tableau thinks it is just a numeric field.
Therefore, it no longer automatically belongs to a hierarchy, meaning no accidental drilldowns.
Use the DATEPART function to isolate any date component and take out of a hierarchy.
Similarly, the DATENAME function does a similar thing, only this time, for some parts of a date, it returns the name in text.
This’s great and exactly I’m looking for. however, the dashboard didn’t display at all. I really want mass around with the workbook. if that possible? thanks Wendy
Thanks for pointing out the broken dashboards, sometimes this happens with wordpress and I never managed to work out why. Anyway, should be ok with this post now. Thanks for reading.
Hi,
I really like your idea. However i was trying to include the quarter as well.
I used the formula in the calc field as
IIF([MONTH OR WEEK]= ‘week’,’week’ +
STR(DATEPART(‘week’,[ORDERED_CALENDAR_DATE])),
DATENAME(‘quarter’,[ORDERED_CALENDAR_DATE]),
DATENAME(‘month’,[ORDERED_CALENDAR_DATE]))
It says that the calc is correct but i think datepart only satisfies 2 conditions. So i was wondering if there is something that can be done to include the quarter as well
Thanks
@Rishi
I got the solution….this would be helpful …
IF([MONTH OR WEEK]= ‘week’) then ‘week’ + str(DATEPART(‘week’,[ORDERED_CALENDAR_DATE]))
Elseif([MONTH OR WEEK]= ‘month’) then str(DATENAME(‘month’,[ORDERED_CALENDAR_DATE]))
ELSEif ([MONTH OR WEEK]= ‘quarter’) then ‘Q’+ str(DATENAME(‘quarter’,[ORDERED_CALENDAR_DATE]))
else ‘n/a’
End
Hi, the example is useful, but if my custom hierarchy is made of number fields, I can use a bar graph but I cannot draw line graphs, which require a date dimension.
Any hint on how can I build a date hierarchy? I told my manager that maybe it would be better to map our hierarchy to the real date and then let Tableau handle the built-in dates, but he’s concerned about the fiscal year (that we treat in a very peculiar way…)
If you’re concerned about the fiscal year you could still use the Tableau built in date hierarchy (unless your fiscal year is very unusual). Check this out on the Tableau site. If it doesn’t solve your problem let me know. https://onlinehelp.tableau.com/current/pro/desktop/en-us/dates_fiscal.html
Hi there
Was trying to create non standard time periods in a hierarchy format e.g. Start at year and then drill down into 13 x 4 week periods and finally to week? Any idea how i can do this?
You would have to create custom fields and a custom hierarchy. You will need a year field – YEAR([DATE]) – a 13×4 week fields – i.e. IF DATEPART(‘week’,[DATE]) < 5 THEN 'P1'...ETC...END (or user a smarter math based formula instead) - and a week field. Put these 3 fields into a custom hierarchy and you have your non standard hierarchy.
Hi,
I am working on blending two data sets together. When I use my date field from one of the data sets, I get 2015, 2016, and *. Same with quarter, I’ll get Q1, Q2, Q3, Q4, *. Could you help me to figure out why the * is appearing at the end of these?
Thanks in advance!
Trent
Hi Trent, this article may help: https://onlinehelp.tableau.com/current/pro/desktop/en-us/multipleconnections_troubleshooting.html
If not the Tableau forums are your best place to go – I may be able to help but you’ll get a quicker response from the forums. https://community.tableau.com/welcome