How do you shade a bar chart in Tableau? I saw a simple bar chart on the BBC website with the shading of the last few values. In this case the shading of the bar graph indicates the data is subject to change. This article demonstrates one technique to add shading to a Tableau bar chart.

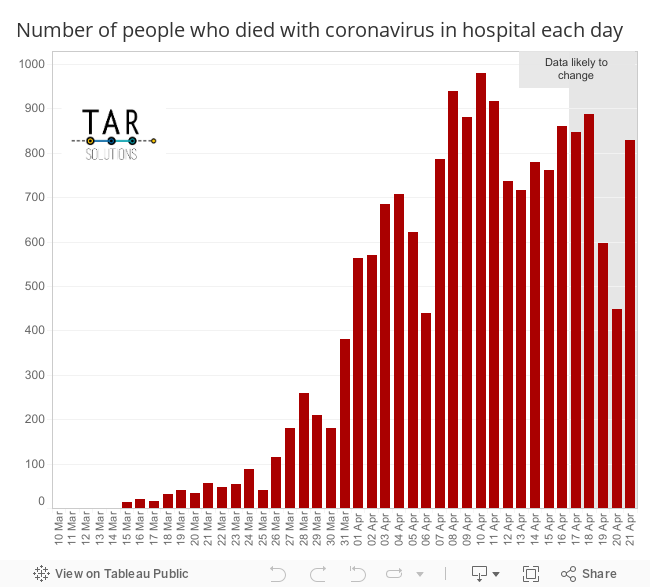
This is the bar chart with shading to recreate in Tableau. The data is available on the UK government coronavirus site.
On the site it states “Data from around 5 days ago can be considered complete”, therefore data from the last 5 days could change. This is signified with the shading behind the bars in the above chart.
(Note I think this is a misinterpretation from the chart developer at the BBC; the Death data doesn’t change historically, it’s the Cases data that does. However we are shading this chart shading as a technical exercise so will ignore that.)
How do I shade a bar chart in Tableau?
To begin load the data in Tableau and build a standard bar chart, with the date on Columns and the Death Count on Rows.
Make sure the date is a discrete value, the blue colour pill, not continuous.

The data to shade is the last 5 days – in this example from the 17 Apr. Therefore the next step is to create a calculated field identifying the past 5 days.
Firstly identify the latest date in the data set – we will go back 5 days from then. A simple FIXED calculation will do that:
{MAX([Reporting date])}
When looking over the entire file there’s no need to use the word FIXED in the calculation, the curly brackets do that job for us.
Now a simple DATEADD (or DATEDIFF would also work) will identify the 5 previous days:
[isSubjectToChange]: [Reporting date]>DATEADD('day',-5,{MAX([Reporting date])})
It’s a simple Boolean formula, returning True when in the 5 previous days and False when before that.
Put the new field to Columns just before the [Reporting date] field.
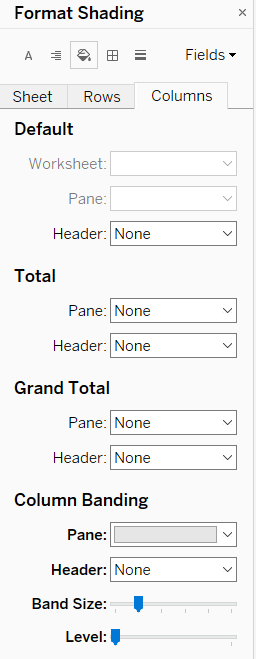
To shade the area is now a case of formatting. Right-click in the bar chart and Format. Format Shading (the paint pot symbol) and Columns. At the bottom of the options is Column Banding. Move the Band Size a notch and put the Level slider to the far left. This should highlight the last 5 days. Set the Column Banding of Header to None. This leaves the dates on the x-axis unshaded.
To add the note stating the “Data likely to change” right-click in the shaded area and Annotate – Area. Similar to powerpoint boxes, it is self-explanatory to move and resize the annotation.
Tidy the bar chart to finish
Finally hide the True and False above the bar chart. Right-click the blue [isSubjectToChange] pill and uncheck “Show Header”.
Should you wish it’s simple to remove the line also separating the 5 days. Instead of Format Shading choose Format Borders and shift the Column Divider to the far left.
And that is it. Download the chart from Tableau Public to see how it’s all put together.

Below is the embedded shaded bar chart in Tableau Public.