The standard Tableau label options for line charts in give a lot of flexibility. But what if you want to do something non-standard, something that’s not one of the default options?
In other words, you want custom labels for your marks.
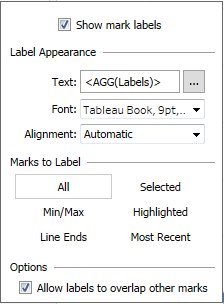
Standard options for labels are quite comprehensive, including:
- All points
- Min and / or Max points
- Start and End points of the lines
- The Most Recent point
How to create custom mark labels in Tableau
Perhaps within your Tableau line chart you want to show labels for the Min, Max AND the Most Recent values.
This isn’t one of the standard options, however, as with most things in Tableau, this can be achieved with calculations.
Line charts generally show a measure over time. Therefore, the calculation should return Null – with Null being nothing; a blank – for all dates except those with the maximum, minimum and latest values.
As usual, it’s recommended to break larger calculations into small chunks. For this example we need to isolate the following:
1. The Maximum value
2. The Minimum value
3. The Most Recent date
For this example I’ll use the sample Superstore data source. I want to show a trend of sales over time, with labels showing the minimum, maximum and latest values.
Create the calculations
Firstly the Maximum value. Use either LOD calcs or table calculations for this. I’m using a table calculation as I want flexibility, with the maximum value changing dependent on the date filter. (Using LODs would mean having to getting more complicated with context filters, which I prefer to avoid.)
Max Sales: WINDOW_MAX(SUM([Sales]))
Next the Minimum value, which is almost the same as above:
Min Sales: WINDOW_MIN(SUM([Sales]))
The Most Recent date. This time I will use a LOD. Should I want flexibility to move the latest date I could change to a table calculation s. For this example a LOD will suffice:
MostRecent: {MAX([Order Date])}
Now I can bring these together creating the Labels calculated field:
Labels:
IF [Max Sales] = SUM([Sales]) //Max Sales
OR [Min Sales] = SUM([Sales]) //Min Sales
OR ATTR([Order Date]) = MAX([MostRecent]) //Latest date
THEN SUM([Sales])
END
This returns the sales amount for the minimum and maximum dates and also return the sales for the most recent date. Ensure the table calculations are set to compute using the Order Date.
Check and use the labels calculation
To test it works set it up in a simple table.
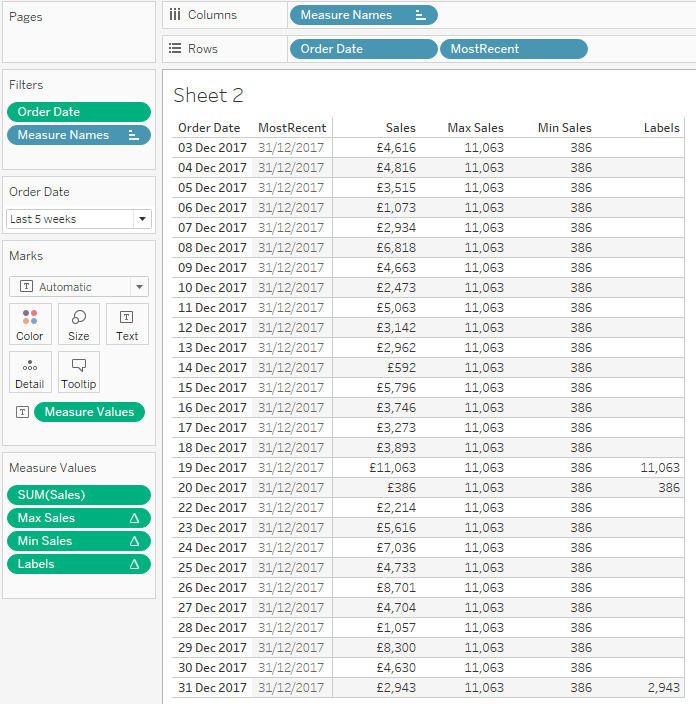
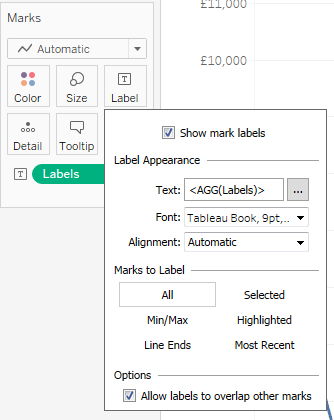
Migrating this to a line chart is straightforward, simply put the field [Labels] on the Label shelf and make sure the Marks to Label is set to All.
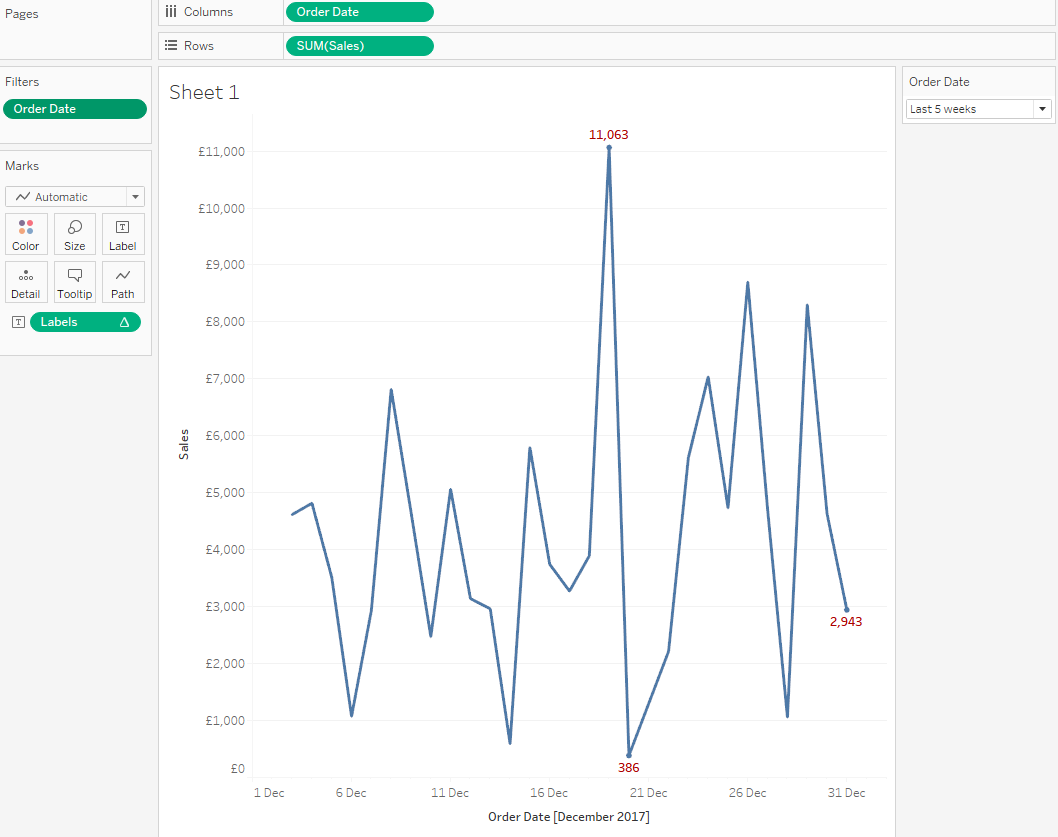
The final worksheet looks like this, including some minor formatting of the label colour:
I did not work