In Tableau the default number of discrete (blue pills) columns in a table is six.
A setting can increase this to 16. In the Analysis menu—Table Layout—Advanced—Rows: Maximum Levels… the number of columns can increase to 16.
There is a workaround to add 17 dimensions to your table.
How to have an extra dimension on your Tableau table
Continuous measures (green pills) do not have this constraint.
You’re able to add many measures (green pills) to your table. I don’t know how many exactly, but it’s enough to take you to a point where any more would be useless; too much information.
To include multiple measures in a table, just use one pill, Measure Names. There is another article explaining how to add multiple measures to a table.
The Placeholder technique is another way to add many items to a table, and also conditional formatting. However, this also comes with constraints, which are described in the article.
This article is about adding dimensions, or discrete measures, to your table.
Use the Text Shelf to add an extra dimension to your table
Tableau is not really designed for showing tabular data but sometimes it’s useful to show line item data as part of a drill down in a table Another example, maybe you’re creating a report specifically with the purpose to export to Excel.
Note, if creating something with the sole aim of exporting to Excel, with no thought around how it appears on screen in Tableau, place all of the fields for export on the Detail shelf. They won’t appear in the Tableau dashboard BUT they will appear in the data export.
In Tableau, if putting dimensions/discrete measures as columns in a table, you are limited to 16 discrete pills before they start to merge. There is a little trick available to put one more column, the 17th column, into the table.
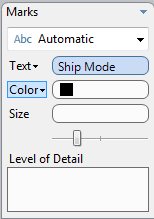
1. Drag the pill into the Text shelf. In this example I’ve used a Dimension called ‘Ship Mode’

2. Drag the ‘Measure Names’ pill from the Dimension section into the Columns Shelf. In the column headings you’ll notice this column now has the heading No Measure Values.

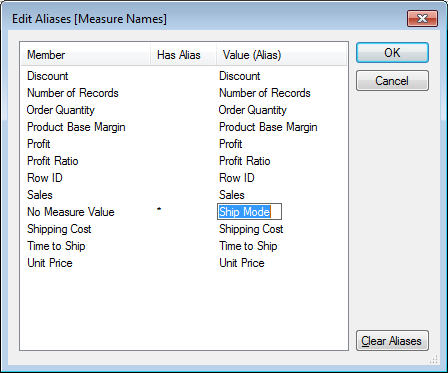
3. Click the arrow on the Measure Names pill and select Edit Aliases

4. Find the Member ‘No Measure Value’ and set the Value (Alias) to be the name you want for that Dimension

5. That’s it, you now have 17 dimension columns in your table!

Another route would be to use the main menu option Analysis->Table Layout->Advanced and adjust both of the options in the Rows section, “Maximum level of row labels” and “Maximum levels of horizontal row labels” to a number higher than the default of 6.
Yes in the display they look like Columns, but they are Row Labels, and VizQL really treats discrete pills on the Rows and Columns shelves as steps in a hierarchy, with the left-most pill being the highest level.
I can understand that this may be confusing, it can seem counter intuitive if you are used to spreadsheets, but Tableau is not like a spreadsheet application, it approaches data very differently.
Please get in touch if you would like to discuss.
I wish I knew about that option earlier, makes things far easier, thanks for showing me that exists. Fully agree that Tableau is nothing like a spreadsheet application but sometimes these tables are very useful – especially if the client insists on being able to export to Excel.
Thanks Joe. Great tip. I was going crazy, and yes, I have to replicate some Excel reporting until I can get them fully over to Tableau.
How would you have the display show either “All” or not display any values when a filter value is not selected for a level for your example above?
Sorry, I don’t understand what you’re asking, can you please elaborate?
I have 12 dimensions that I am trying to display with no measures and thought this approach would work. I did Analysis->Table Layout->Advanced and adjust both of the options in the Rows section, “Maximum level of row labels” and “Maximum levels of horizontal row labels” to 12 but I am still getting a column at the end of my table that displays ‘Abc’. Is it possible to suppress/hide this last column if I have more than 7 dimensions?
There’s a technique for this, you put the dimension in the ABC column.