
How to shade a Tableau bar chart
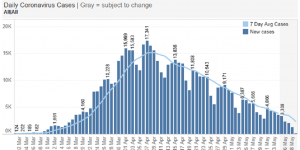
How do you shade a bar chart in Tableau? I saw a simple bar chart on the BBC website with the shading of the last …
How do you shade a bar chart in Tableau? I saw a simple bar chart on the BBC website with the shading of the last …

Tableau automatically optimises a dashboard to fit the device, meaning it resizes for viewing on mobile devices. Whether a desktop, tablet or various sizes of …
(The data provided by the govt for this information has changed, meaning we no longer update the regional view of Covid. The high level view …

Do you want to track the spread of coronavirus in the UK? The below dashboard, based on UK govt data, enables monitoring of coronavirus trends …

Over the years we have completed many data and insight projects. Sometimes in the early stages of these data projects it can be a challenge …

A key challenge for asset managers is how to extract value from all of their asset management data. Many Asset Managers are large and globally …

A browse on LinkedIn presents post after post of artistic, very well designed and highly complex Tableau dashboards. Many of the dashboards shared on LinkedIn …

A standard technique to add colour to a column in Tableau is to use a Square mark type. This is how Tableau itself creates a …

Creating tables in Tableau with Excel style conditional formatting is a common ask of Tableau developers. Sometimes this can be technically difficult, with Tableau placeholders …

Creating conditionally formatted tables is a regular request for Tableau consultants. This is very similar to what users are used to in Excel. For example, …