
Data to Information Ladder
How to turn data into information Many organisations have a lot of data without much idea what to do with it. Converting data into useful …
How to turn data into information Many organisations have a lot of data without much idea what to do with it. Converting data into useful …

This article shows two different techniques of how to do sheet swapping in Tableau. Sheet swapping is where sheets are hidden/displayed (swapped!) depending on user …

There are a small number of use cases where Tableau scaffolding is the solution. In Tableau, scaffolding dates is used to “fill in” missing dates, …

How to remove the abc column may be the most commonly asked Tableau question. Hiding the abc column in Tableau is one of those tasks …

How do you shade a bar chart in Tableau? I saw a simple bar chart on the BBC website with the shading of the last …

Tableau automatically optimises a dashboard to fit the device, meaning it resizes for viewing on mobile devices. Whether a desktop, tablet or various sizes of …
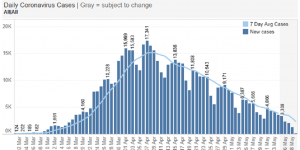
(The data provided by the govt for this information has changed, meaning we no longer update the regional view of Covid. The high level view …

Do you want to track the spread of coronavirus in the UK? The below dashboard, based on UK govt data, enables monitoring of coronavirus trends …

Over the years we have completed many data and insight projects. Sometimes in the early stages of these data projects it can be a challenge …

A key challenge for asset managers is how to extract value from all of their asset management data. Many Asset Managers are large and globally …